Observing the Sakana Fugu API with Langfuse: Understanding Hidden Costs in Multi-Agent Systems
A hands-on report instrumenting Sakana Fugu's OpenAI-compatible API with Langfuse, measuring how latency, token consumption, and TTFT change across Level 1–3 tasks.
I signed up for Sakana Fugu and planned to observe from the outside how reliable an integrated API bundling multiple models and roles could be in production.
Sakana Fuguを契約したので、マルチエージェントAPIの見えなさをLangfuseで観測する OpenAI互換APIとしての性質と、ブラックボックスな協調推論を外側から観測するための検証計画。 https://llm-lab.dev/posts/sakana-fugu-langfuse-observability-plan/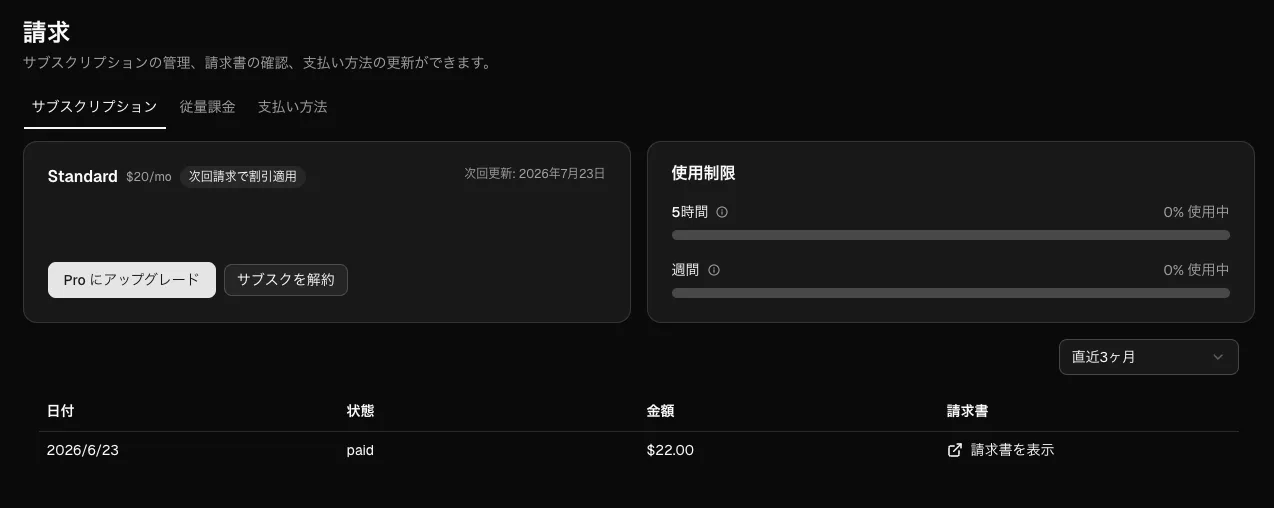
This time, as a follow-up, I actually instrumented the Fugu API with Langfuse, threw three difficulty levels of prompts at it, and measured total latency, TTFT, token consumption, and how usageDetails behaved.
The measurement approach was simple: call Fugu as an OpenAI-compatible API, instrument it with Langfuse’s OpenAI-compatible client, and send prompts from Level 1 through 3. Then I pulled traces and observations back from the Langfuse API to verify input, output, latency, usage, and observations as API-boundary measurement values.
I can’t see what Fugu is doing inside the LLM from my side as a subscriber, but values trackable from the outside can be preserved through Langfuse.
Connecting to Langfuse
Since Fugu can be called as an OpenAI-compatible API, it fit directly onto Langfuse’s OpenAI-compatible client. Because existing OpenAI SDK and Langfuse instrumentation can be used with almost no rewrites, in my local code I only had to change the model name to fugu and point the base URL to Sakana’s endpoint, and latency and usage started showing up as traces.
The instrumentation entry point is just this. If you put the experiment name in metadata, you can later collect traces grouped by this experiment unit.
import os
from langfuse.openai import OpenAI

client = OpenAI(
    base_url="https://api.sakana.ai/v1",
    api_key=os.environ["SAKANA_API_KEY"],
)

response = client.chat.completions.create(
    model="fugu",
    messages=[{"role": "user", "content": "おはよう"}],
    name="fugu-smoke-test",
    metadata={"experiment": "fugu-langfuse-observability"},
)
I started by throwing just a single “おはよう” to confirm that the measurement path delivering trace, usage, and TTFT to Langfuse was working. For short-lived processes, the trace can be missing because the process ends before the send queue is flushed, so in this kind of validation I explicitly call flush() to drain the queue before exiting.
Prompts Used
I prepared 3 questions each for Level 1 and Level 2, and 2 questions for Level 3. Calls were split into two tracks: non-streaming calls for usage and total latency, and streaming calls for TTFT.
| Level | Count | Input Summary | Main Metrics Collected |
|---|---|---|---|
| Level 1 | 3 | Shinkansen travel time, capital of Japan, Python Hello World | Baseline latency, usage, TTFT |
| Level 2 | 3 | Fruit box logic puzzle with wrong labels, salary calculation, hat color puzzle | Latency and token increase on reasoning tasks |
| Level 3 | 2 | AgentOps runbook using Sun Tzu’s Art of War, prompt injection response runbook | Long duration and large usage in multi-perspective synthesis |
For sending each level, I used a custom verification script prepared for this article. It is a small script that sends level-specific prompts to the Fugu API and leaves traces in Langfuse under that experiment name, not a standard CLI. I ran it locally with the following separation of calls:
# Non-streaming (for usage and total latency)
python scripts/01_level1_simple.py
python scripts/02_level2_reasoning.py
python scripts/03_level3_complex.py
Having Fugu Read Langfuse Traces
This time, I had Fugu itself organize the Fugu API experiment results!
I passed it the Langfuse for Agents documentation and had it devise a policy for retrieving traces and observations by experiment name. From there, it aggregated latency, TTFT, and usage by level, and even produced graphs for the article. This wasn’t just “asking Fugu questions”; it was using Fugu as a reader of observability data.
Having the observed model also organize the observation results feels appropriately AgentOps-ish and interesting.
In actual retrieval, hitting rate limits when pulling trace details one by one caused me to switch to the observation list API. For streaming calls, usage was recorded as 0 on Langfuse, so I separated usage from non-streaming observations and TTFT from streaming observations.
Level 1: Simple Fact Checking
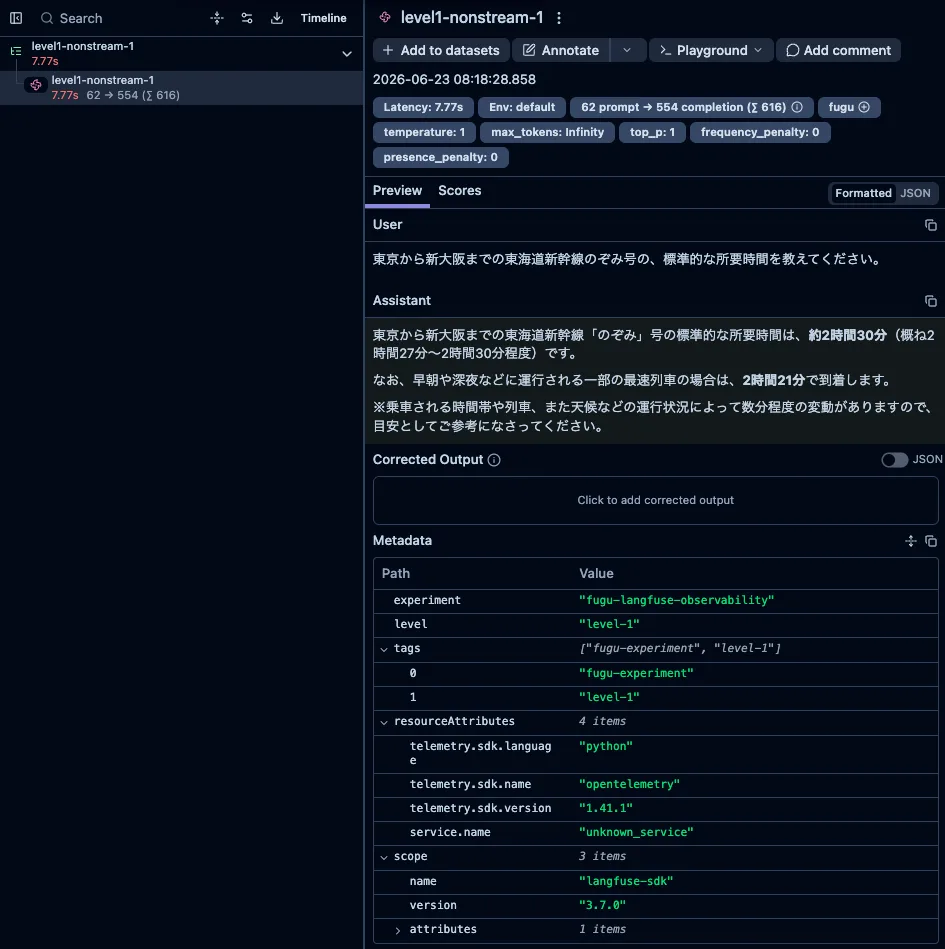
Level 1 consists of three questions with a single definitive answer: Shinkansen travel time, capital of Japan, and Python Hello World. As a representative example, here is the Shinkansen question.
東京から新大阪までの東海道新幹線のぞみ号の、標準的な所要時間を教えてください。
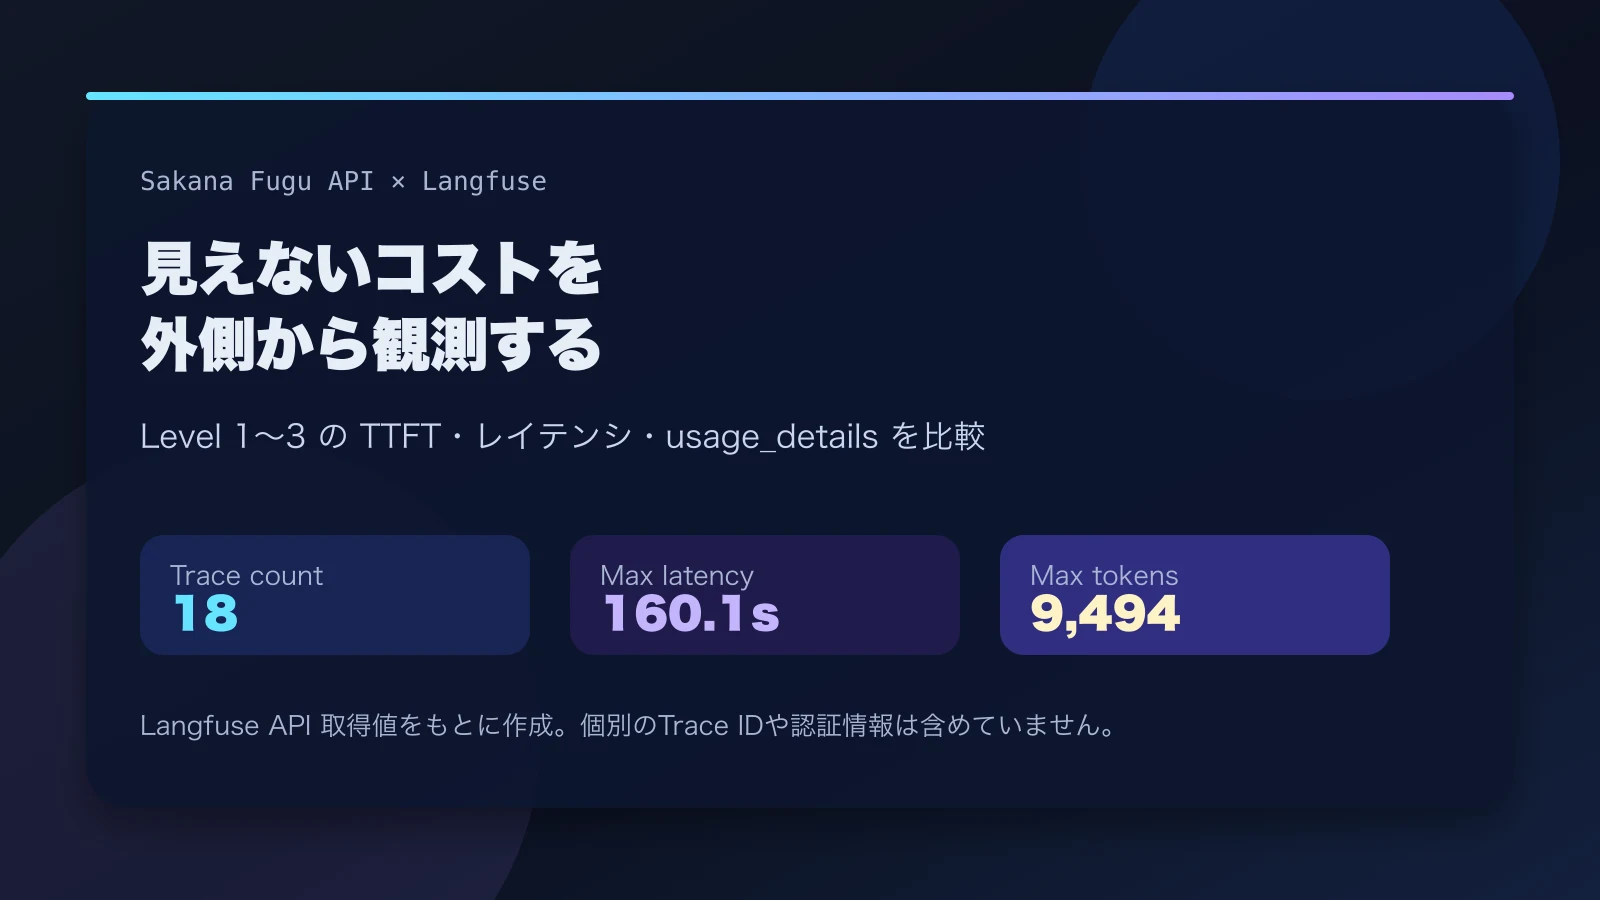
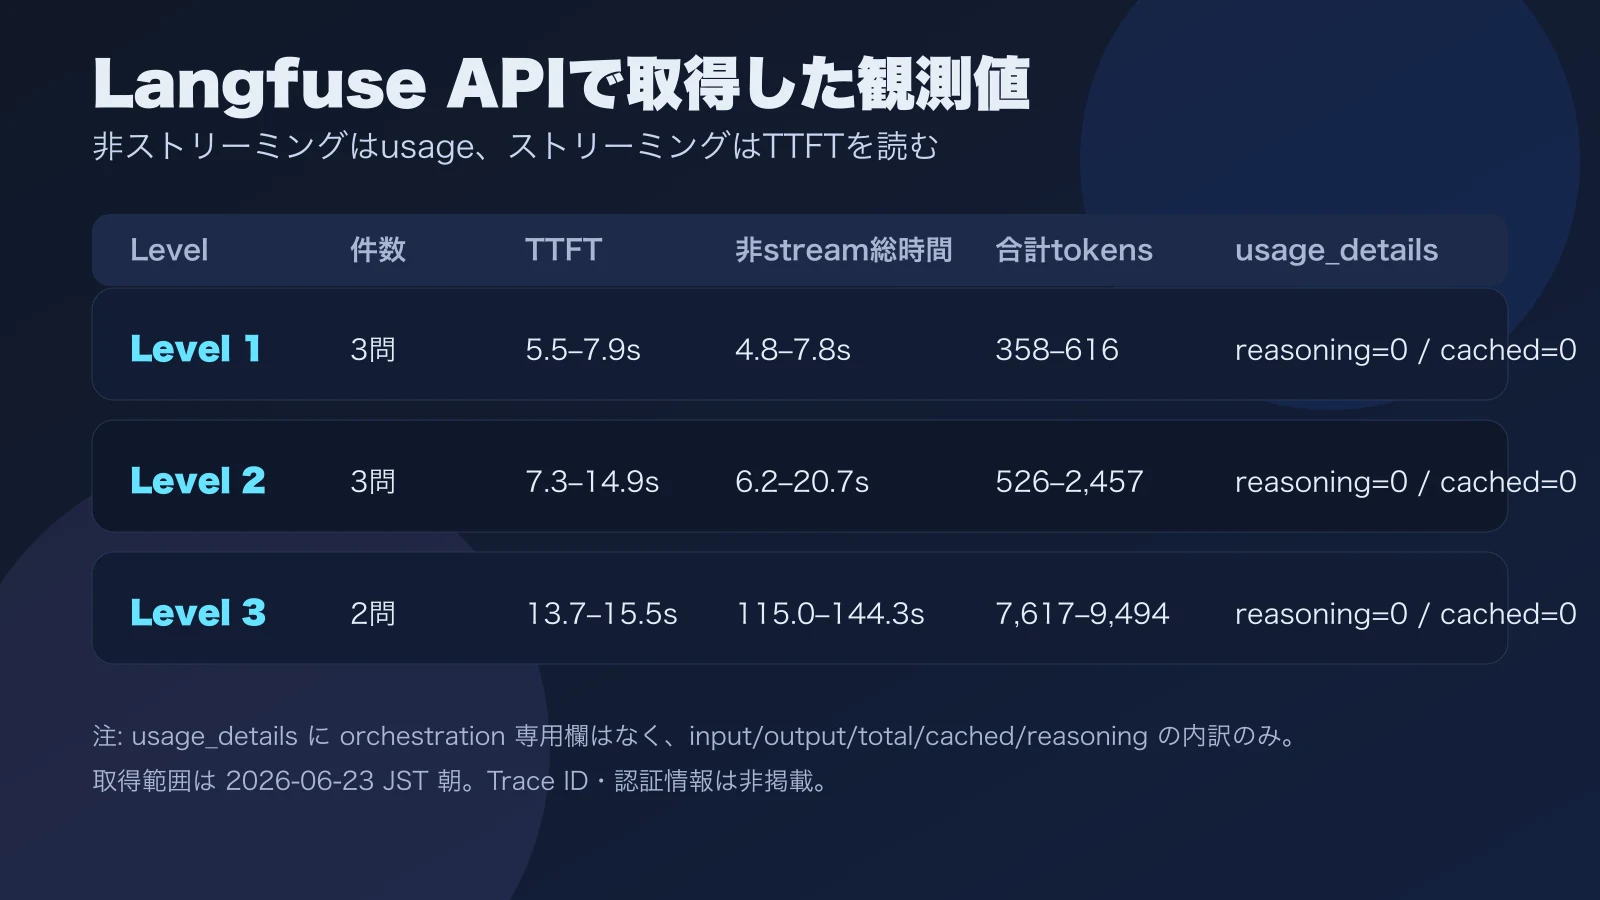
Non-streaming total latency for this level was about 4.8–7.8 seconds, and TTFT recorded in Langfuse during streaming was about 5.5–7.9 seconds. Total token count was about 358–616 tokens.
Even for short fact-checking, it is worth remembering that several hundred tokens are counted in total. Even if the answer on screen is only a few lines, there is considerable thickness in usage. Reading cost by the apparent character count of the output leads to a misestimate.
Level 2: Logical Reasoning
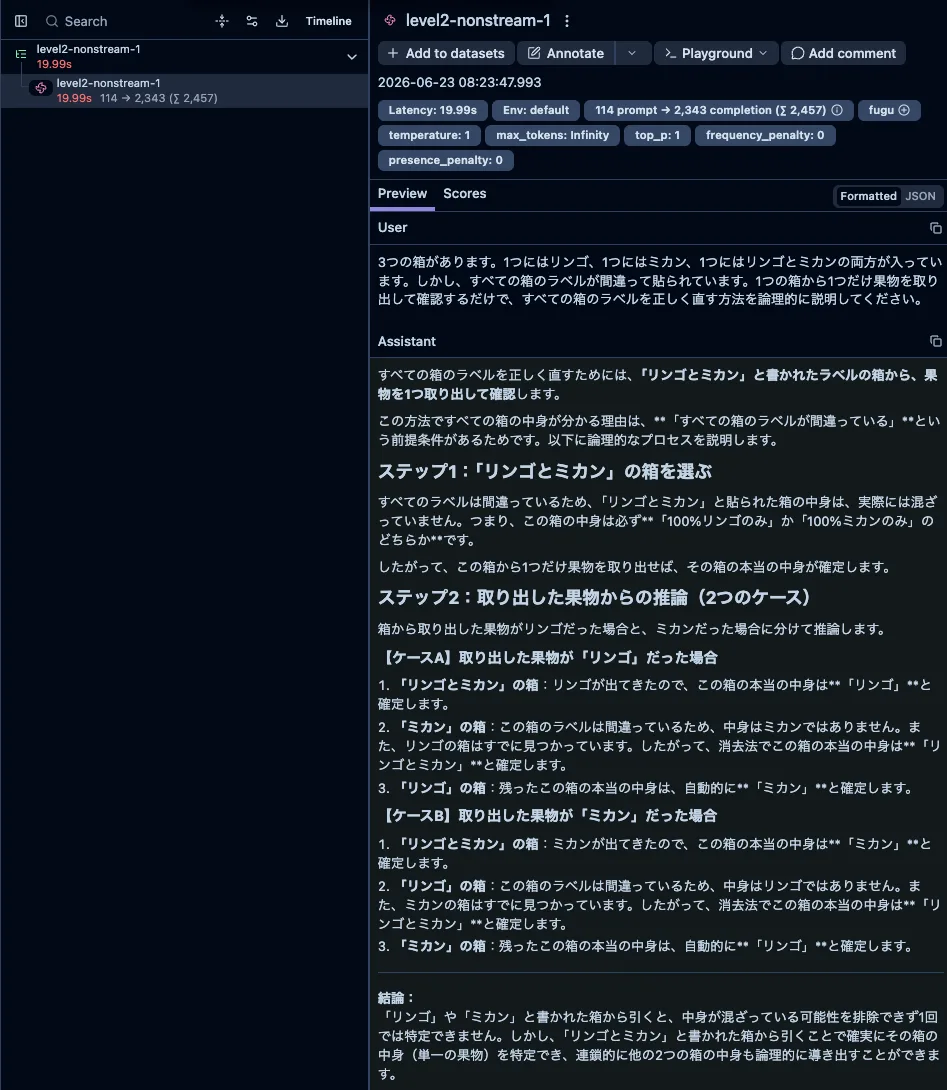
Level 2 consists of three slightly more thoughtful questions: identifying the contents of a fruit box where all labels are wrong with minimal confirmation, a conditional salary calculation, and a hat color puzzle.
Non-streaming total latency was about 6.2–20.7 seconds, streaming TTFT was about 7.3–14.9 seconds, and total token count was about 526–2,457 tokens, showing wider variance than Level 1.
What was interesting is that within the same Level 2, the salary calculation finished in about 6.2 seconds and 526 tokens, which was much lighter than the fruit box or hat color puzzles. Even though I intended to divide difficulty into three levels, what actually determines weight does not seem to be the level number itself, but rather how much exploration and case branching the problem demands, and how far the reasoning process must be verbalized. Even with the same level label, latency and tokens can more than double depending on the content.
Level 3: Multi-Perspective Document Synthesis
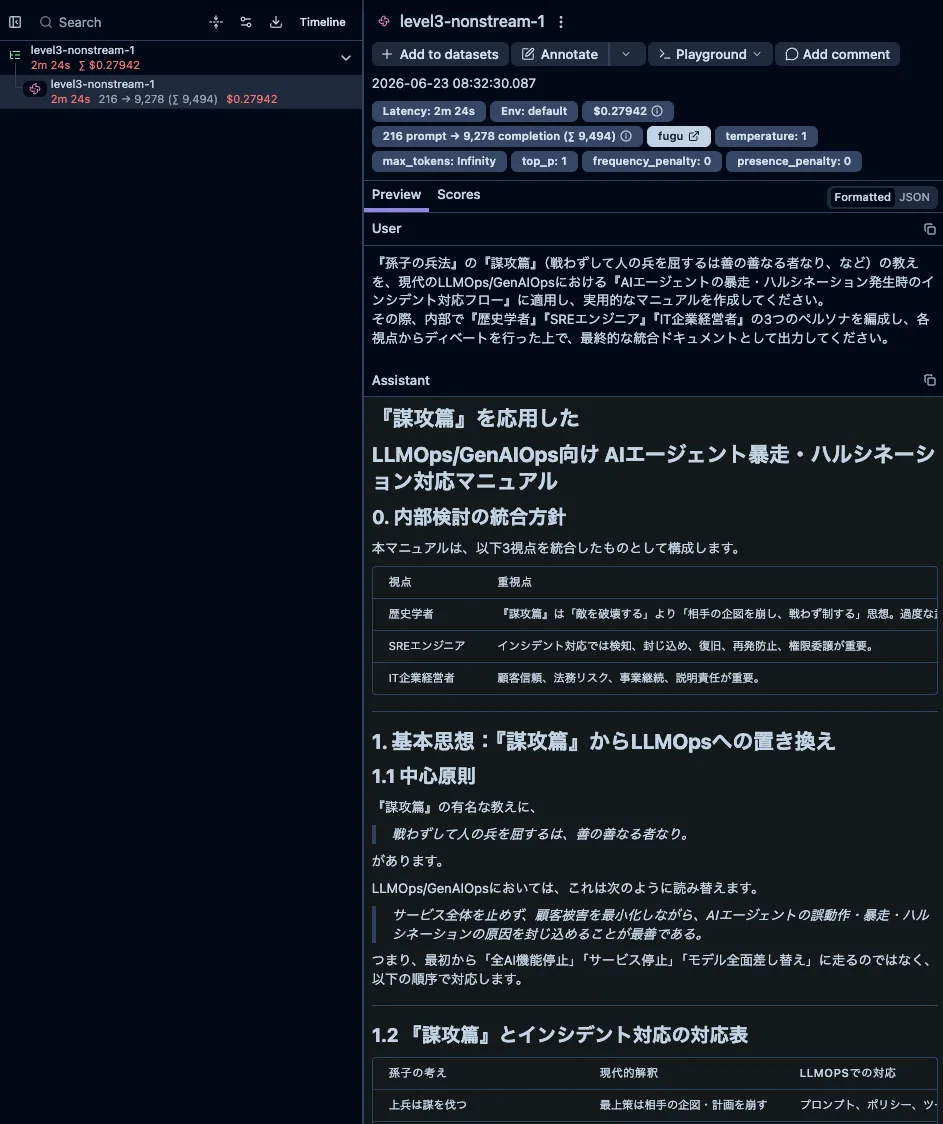
Level 3 involved two longer synthesis tasks. The first was a runbook adapting Sun Tzu’s Art of War to LLMOps and AgentOps incident response flows. The second was a runbook for prompt injection response from the three perspectives of security, product, and SRE. Both aim to consolidate multiple viewpoints into a single document.
Here the order of magnitude for wait time changed. Non-streaming total latency was about 115.0–144.3 seconds, and total token count was about 7,617–9,494 tokens. Whereas Level 1 and Level 2 lived in the realm of seconds, Level 3 casually consumes around two minutes. It sits unresponsive for a while after being called, so at first I thought it had stalled.
TTFT values diverged depending on which layer measured them. In my local streaming measurement, the first content chunk for Level 3 task 1 took about 72.6 seconds to arrive. Meanwhile, in the Langfuse API’s timeToFirstToken, the two Level 3 tasks were about 13.7–15.5 seconds. Even with the same “TTFT” label, the digits differ by one order of magnitude.
This part is quite important. Even under the same name “TTFT,” the meaning shifts depending on whether you measure it at the SDK, stream chunk, or body string level.
Which event the SDK treats as the first token, which stream chunk you use as the starting point, and whether you measure at the timing when the body string actually arrives. Differences in these measurement methods can produce gaps of tens of seconds for the same call. If you use TTFT as an operational metric, you cannot compare values unless you align which layer they were measured at.
What usageDetails Revealed (and Didn’t)
Total token count swelled significantly at Level 3. Looking only at the final output length, it is not fully possible to explain why the token count reaches this level. Regardless of how multiple perspectives are bundled internally, the API-boundary usage carries more weight than it appears.
However, checking the Langfuse API’s usageDetails did not surface any internal coordination-specific fields such as orchestration_tokens. What was visible were only general breakdowns such as input, output, total, cached input, and reasoning tokens.
{
  "input": 216,
  "output": 9278,
  "total": 9494,
  "input_cached_tokens": 0,
  "output_reasoning_tokens": 0
}
At first I thought “orchestration tokens aren’t visible here.” But after re-reading Fugu’s documentation, I realized I might be looking in the wrong place.
Fugu’s documentation recommends using the Responses API rather than the Chat Completions API for generation requests. Furthermore, in Fugu Ultra, there are usage fields that separate user-visible model work from orchestration work, returning as input_tokens_details.orchestration_input_tokens and output_tokens_details.orchestration_output_tokens.
In other words, the reason I couldn’t see it in Langfuse’s usageDetails this time may not be that internal coordination doesn’t exist, but that the API and fields I was looking at were different. This instrumentation leaned toward Chat Completions, and on the Langfuse side I was looking at normalized values as OpenAI-compatible usage. Unless raw usage from Fugu Ultra’s Responses API is saved and cross-checked, the breakdown of orchestration work cannot be determined.
On the Langfuse side, I could actually pull the data back. Filtering traces by experiment name and retrieving usageDetails, timeToFirstToken, latency, and model from the Observation API confirmed that usage becomes 0 for streaming calls, while input/output/total are present for non-streaming calls. This matches the per-level numbers in the article.
On the other hand, confirming raw usage from the Fugu Responses API still has some sticking points. I tried throwing fugu-ultra at /v1/responses with a short input, but in my local call it returned HTTP 200 with {}, and I could not retrieve the usage field. It doesn’t seem to be an authentication or reachability issue, but I need to check further on request format, model specification, and differences via SDK.
What I want to check next is throwing the same Level 3 prompt via the Responses API and comparing raw response usage fields with Langfuse observations. Using Langfuse for Agents CLI or API, I have confirmed that traces/observations can be pulled back by experiment name. If I leave Fugu’s raw responses as JSONL alongside that, I should be able to see at least the following correspondences.
| What to See | Where to Look |
|---|---|
| Final input/output/total tokens | Fugu Responses API raw usage |
| orchestration input/output tokens | Fugu Ultra input_tokens_details / output_tokens_details |
| Normalized usage on Langfuse | Langfuse Observation usageDetails |
| TTFT and total latency | Langfuse Observation and local streaming measurement |
Looking at it this way, it seems less accurate to say “Langfuse couldn’t see it” and more accurate to say “I wasn’t separating raw usage before it entered Langfuse from usage after it entered Langfuse.” This difference is quite important if you plan to actually operate Fugu in production. Raw usage retrieval via the Responses API remains homework for next time.
Internal role-by-role conversation logs are not visible. What I could observe was the fact that Level 3 is clearly heavy in terms of API-boundary usage and latency. This is not a story about being able to peek into internal dialogue.
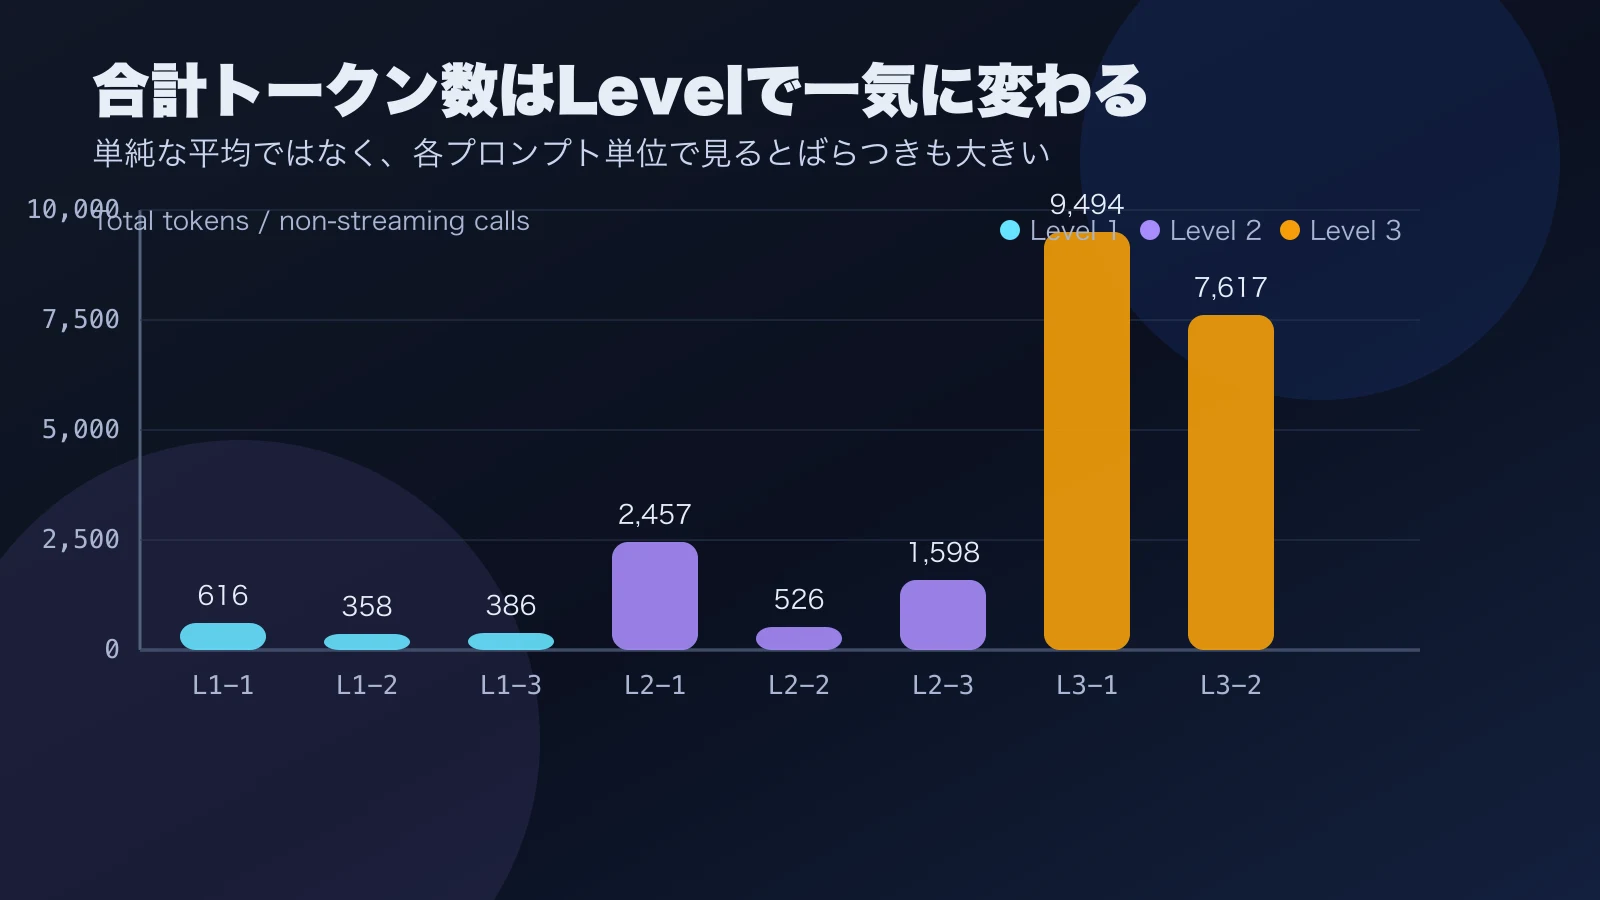
From this graph, you can read that while Level 3 total token count stands out, even Level 1 counts several hundred tokens for short answers, and Level 2 has large internal variance. It seems impossible to explain everything with either “tokens are high because the output is long” or “tokens are high because multiple internal roles are running.” From an operational perspective, I felt it is more practical to establish a usage baseline per prompt type and individually trace traces that jump from there.
Can Fugu Replace a Custom Agent?
Based on these numbers, it is easier to find the right use cases for Fugu if you view it not as “a slightly smarter LLM replacement” but as “an API that handles heavy reasoning and multi-perspective synthesis in one go.”
Building thought, execution, and verification loops yourself with LangChain or Flue means carrying state management, error handling, and prompt tuning yourself. Fugu looked like an option that could shift some of that to the other side of the API. For simple fact-checking or routine processing, ordinary LLM calls or local agents seem sufficient in many cases. On the other hand, for scenarios requiring complex logic construction or multi-persona integration, there is more room to hand the entire heavy processing like Level 3 over to Fugu.
However, the internal structure is not fully visible from the subscriber side. That is precisely why continuously tracking TTFT, total latency, usage, and error rates from the outside is a prerequisite. Where to delegate to the API and where to control with your own agent framework. I believe this line should be drawn based on observational values left in Langfuse, not on impressions of performance.
Summary
Here is what I was able to observe this time.
- Sent 3 questions each for Level 1 and Level 2, and 2 questions for Level 3.
- In streaming calls, looked at TTFT; in non-streaming calls, looked at usage.
usageDetailsdid not contain internal coordination-specific fields.- At Level 3, total latency and total token count increased significantly.
- TTFT values diverged depending on the measurement layer.
- Fugu Ultra’s Responses API raw usage may contain orchestration work breakdowns, but in my short local check
/v1/responsesreturned HTTP 200 with{}and I haven’t yet retrieved theusagefield.
As an operational image, rather than using the Fugu API for everything all the time, treating it like an external specialist team that you call only for heavy tasks seems to make it easier to balance cost and controllability. This is the current feel, and there are still parts I can’t definitively state without increasing the variety of prompts and observing more. Next, I plan to cross-check Responses API raw usage with Langfuse observations to dig a bit deeper into what is driving up token counts.