I Want to Build a Langfuse Morning Briefing That Pushes Only Anomalies to Slack
Manually checking traces every day is unsustainable. A personal GenAIOps plan to aggregate Langfuse failures, token spikes, and low-score outputs into a single Slack morning briefing.
Langfuse is useful, but checking it every day is simply not sustainable.
Traces pile up. Tokens accumulate. Occasionally something strange slips through. You can see it all if you open the dashboard, but when you are juggling a day job and side projects, the habit of “patrolling Langfuse every morning” tends to collapse.
But I do not actually want to see everything.
What I want to know is which Agent failed yesterday, where tokens spiked, whether cost jumped unexpectedly, and whether any low-score outputs appeared. That is all.
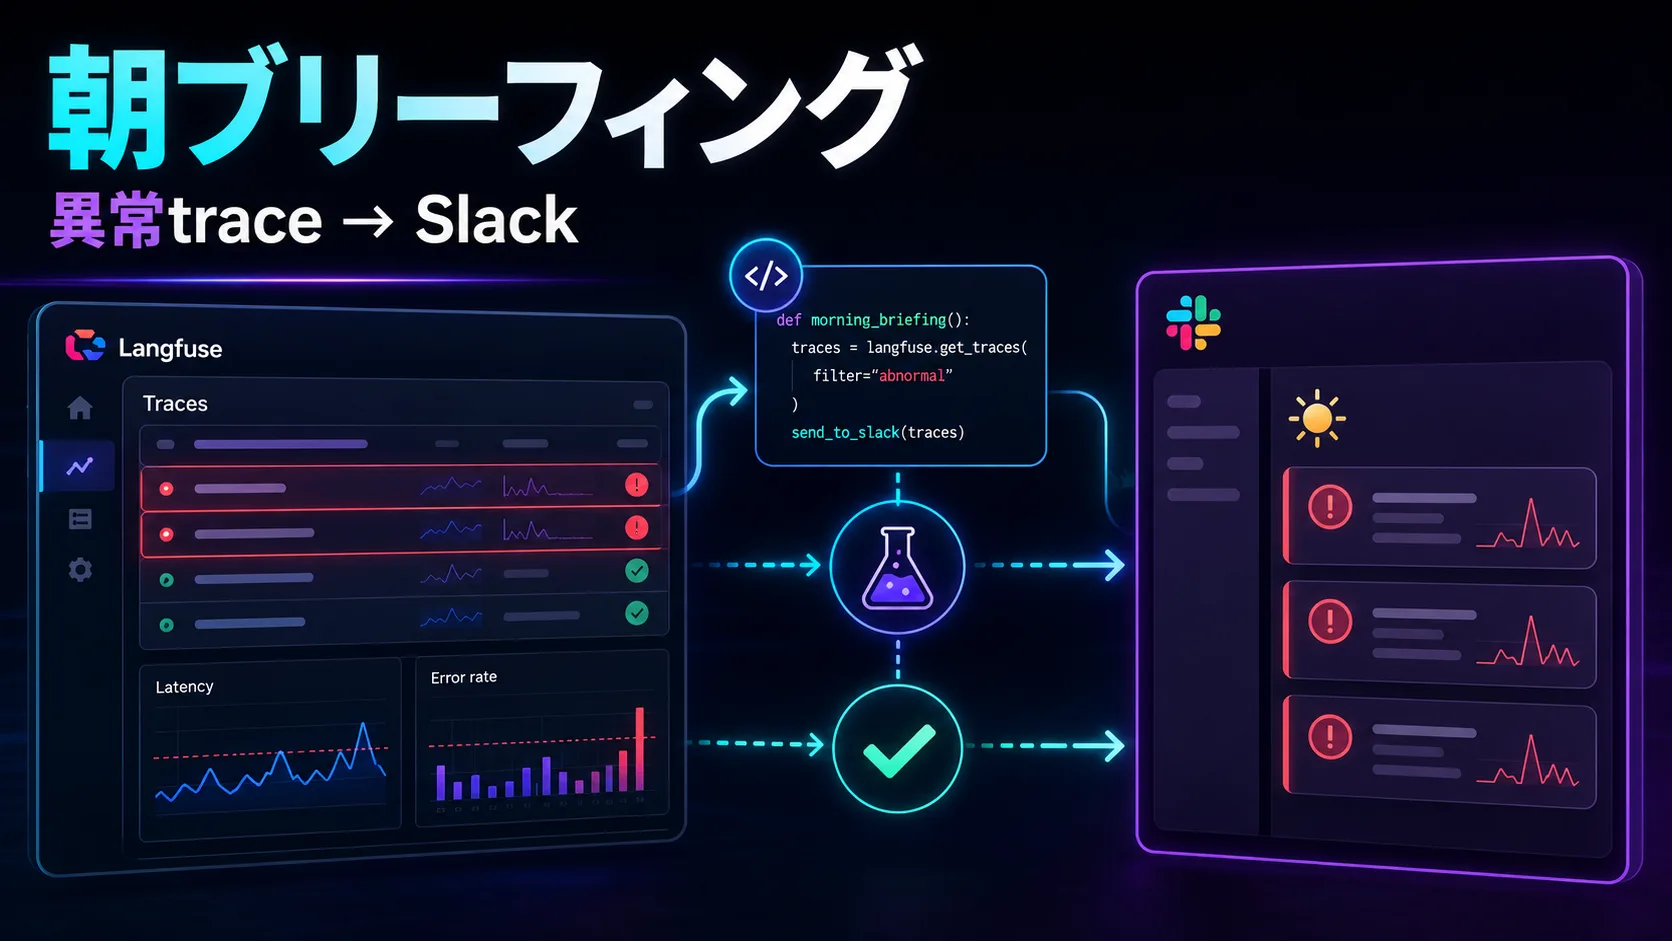
So this post is about building a system that collects Langfuse traces and pushes only the anomalies worth investigating to Slack as a morning briefing.
This is not yet a completed implementation report. At this stage it is a planning memo that organizes the desired architecture, key metrics, implementation breakdown, and verification TODOs.
What is painful
When working with LLM apps and Agents, the list of things you want to observe grows quickly.
- Traces that ended in error
- Runs that consumed way too many tokens
- Runs with unusually high latency
- Runs where cost spiked suddenly
- Outputs with low evaluation scores
- Unexpected tool calls
- Rough outputs that should never reach users
Langfuse is quite useful as a place to track these behaviors after the fact.
However, an observability platform is weak when it turns into “you only notice if you go look.” Open the dashboard and you will see it. But you do not open it. Because you do not open it, you only notice after something goes wrong. To be blunt, this is a common pattern in personal projects.
What I really need is not to look at every trace every day.
I need yesterday’s runs boiled down to only what is worth looking at today.
What I want to build
I want to build a Langfuse morning briefing.
Once every morning, it posts something like this to Slack.
- Yesterday’s execution summary
- Failed traces
- Runs where tokens or cost spiked
- Runs with high latency
- Low-score outputs
- Priority trace URLs to investigate
- Suspected root causes
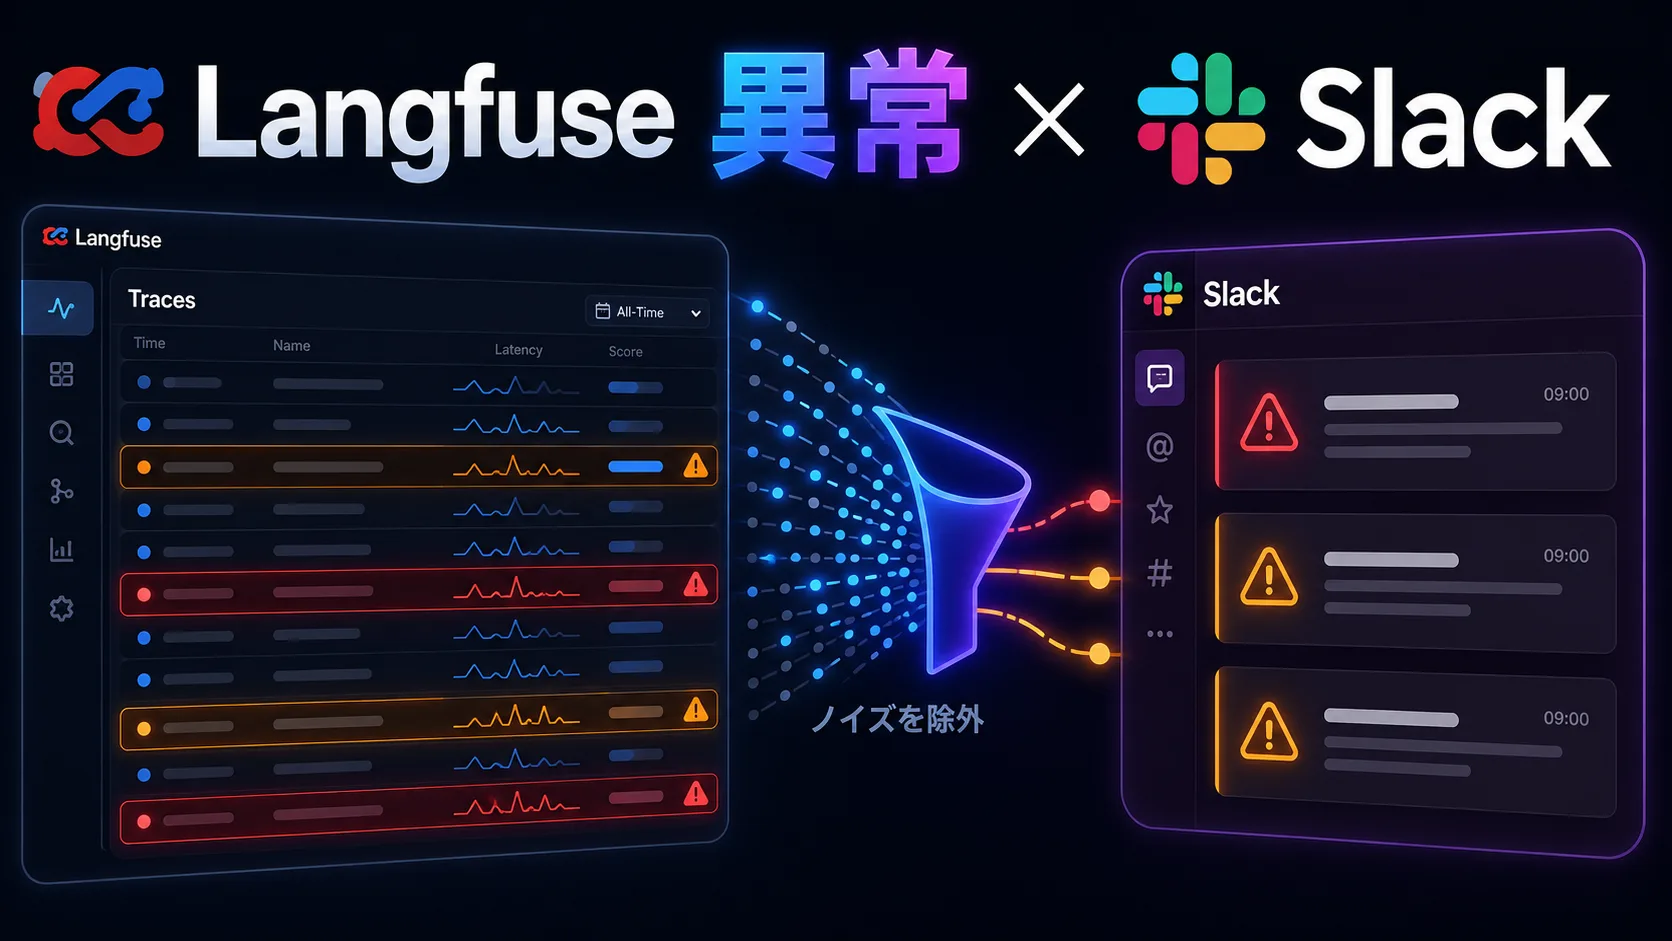
If everything is notified, notification fatigue sets in immediately. So the policy is: keep it short on normal days, and make it dense only when anomalies occur.
For example, I want Slack notifications that look like this.

Langfuse Morning Briefing

Yesterday's runs:
- traces: 128
- errors: 3
- total tokens: 412,000
- estimated cost: $2.31

Anomalies worth reviewing:
1. hermes-pricing-agent: 2 error traces
2. blog-draft-agent: tokens up +82% vs previous day
3. support-rag: 1 trace with declining score

Check first:
- https://cloud.langfuse.com/project/...
This is short enough to skim in the morning.
Overall architecture
The minimal setup is quite simple.
Langfuse
  ↓
Scheduled worker / cron
  ↓
Fetch traces and metrics
  ↓
Filter anomaly candidates by threshold
  ↓
Summarize briefly with an LLM
  ↓
Post to Slack Incoming Webhook
I will not build a complex monitoring platform from the start. The goal is not to complete an alerting system, but to create a path that surfaces anomalies without having to visit Langfuse every day.
Cloudflare Workers Cron Triggers seem like a convenient place to implement this. If your blog and personal tools are already on Cloudflare, the operational surface stays unified.
That said, this is still TBD. The final choice depends on verifying the Langfuse API retrieval scope, authentication, rate limits, and how to assemble trace URLs.
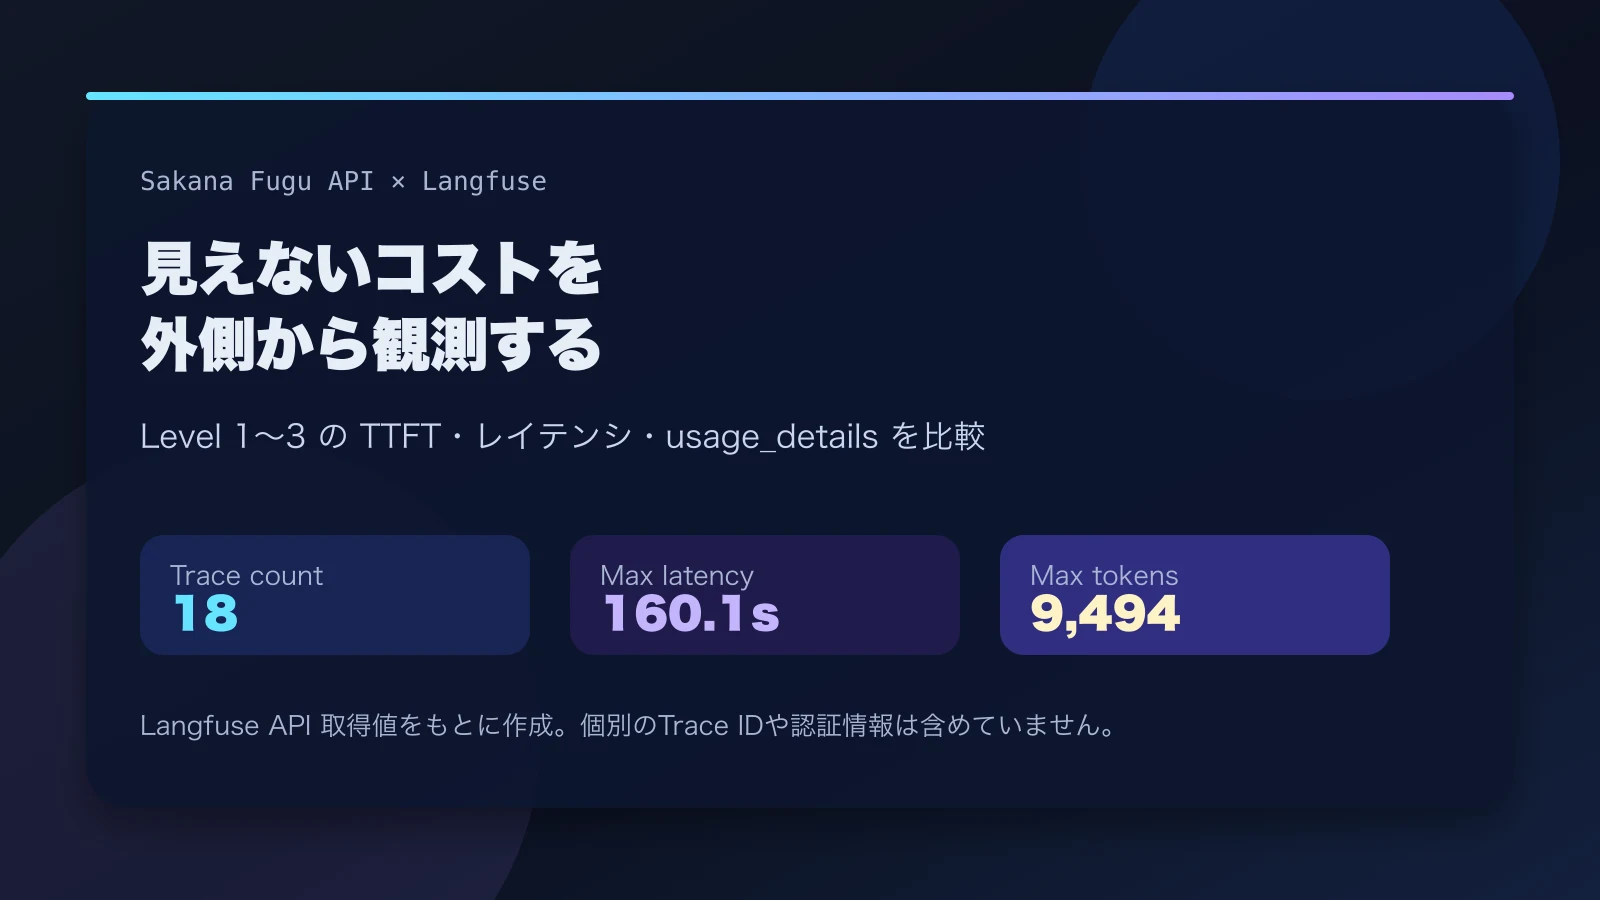
Which metrics to watch
I will keep the initial metrics small.
| Metric | What to check |
|---|---|
| error count | Whether failed runs are increasing |
| total tokens | Whether tokens are spiking |
| estimated cost | Whether cost is exceeding expectations |
| latency | Whether any runs are abnormally slow |
| score | Whether any low-quality outputs exist |
| model | Whether an unexpected model is being used |
| agent / prompt name | Which process produced the anomaly |
The key is to look at both absolute values and day-over-day changes.
For example, 100,000 total tokens might be completely normal. But if an Agent that normally uses around 10,000 tokens suddenly consumes 80,000, that is worth a look.
So the initial filtering criteria will look like this.
- Traces with errors
- Agents whose total tokens increased by 50% or more vs the previous day
- Runs whose estimated cost exceeded a threshold
- Runs whose latency far exceeded the p95
- Traces whose score fell below a specified value
It is more realistic to adjust these rules after a few days of running them than to nail the perfect thresholds from the start.
What to summarize with an LLM
I want the Slack message summarized by an LLM.
But blindly stuffing the full trace text is risky. Token cost rises, and the trace may contain confidential or personal information.
The summary input should be limited to structured metadata.
{
  "date": "2026-06-13",
  "totalTraces": 128,
  "errorTraces": [
    {
      "name": "hermes-pricing-agent",
      "traceUrl": "https://...",
      "errorType": "tool_error",
      "latencyMs": 12400
    }
  ],
  "costAnomalies": [
    {
      "name": "blog-draft-agent",
      "costDeltaRate": 0.82,
      "tokens": 98000
    }
  ]
}
From this, have it produce a short “what to look at today.”
Summarizing the body text, prompt, or completion content is a next-stage concern. First, build the pipeline that discovers anomalies.
How far to automate
In the initial scope, I will not go as far as automated remediation.
The reason is simple: if you build observation and remediation at the same time, it becomes hard to tell where failures occur.
At first, it is enough to push “traces worth reviewing” to Slack. Once that runs smoothly, the next steps are generating root-cause hypotheses, automatically creating issues, and selectively retrying specific failure patterns.
The intended order is:
- Push anomaly traces to Slack
- Have the LLM summarize the reason for the anomaly
- Create investigation tasks in GitHub Issues or Notion
- Automatically retry only some failures
- Have an Agent generate remediation proposals
Jumping straight to step 5 will probably break. Even if rough, start by building the notification you read every morning.
What this system should change
What I want this system to change is how I use Langfuse.
Right now, I mostly open Langfuse when something goes wrong. That is useful, but it is biased toward post-incident investigation.
With a morning briefing, usage shifts slightly.
- No need to open the dashboard every day
- Only dig into traces on days with anomalies
- Catch cost incidents earlier
- Make it harder to leave low-score outputs unattended
- Glance at per-Agent operational health
Even for personal projects, if you are nurturing LLM apps, observability is necessary.
But if observability consumes too much time, it will not last. So instead of visiting the dashboard every day, I want anomalies to flow naturally into my daily routine.
As an entry point for that, a Slack morning briefing feels just right.
Verification TODO
- Confirm which granularity of trace, generation, score, cost, and latency data the Langfuse API exposes for a target date
- Confirm whether Cloudflare Workers Cron Triggers can call the Langfuse API
- Confirm whether Langfuse trace URLs can be reliably constructed from API responses
- Decide where to store day-over-day data for comparison: Workers KV, D1, or local aggregation
- Decide the Slack Incoming Webhook notification format
- Decide the safe metadata scope for LLM summarization; whether to include prompt / completion text is a separate decision
- Set provisional thresholds for error, cost, token, latency, and score, then verify notification volume over several days
The process of verifying these TODOs and implementing them on Cloudflare Workers is documented in the follow-up post “Building a Langfuse Morning Briefing for Slack.”